
There is no average patient
As many of you know, I love to hear your stories of your encounters with your brains. Through a circuitous route (no other type appears to exist in my world) that involves a marvelous final MOOC project by Luiz Meier (more on that another time), I was privileged to receive the following description of a subarachnoid hemorrhage (SAH) from Paul Van Uytrecht, a mutual Facebook friend to Luiz and me. The account below is unedited except for the insertion of a few paragraphs to make it easier to read. Please read it and then stay with me for some comments on the average SAH experience followed by comments on the concept of average more generally.
Paul Van Uytrecht’s subarachnoid bleed
“On Sunday 3rd August 2014, at around lunchtime, I developed what I now know are the classic signs of an SAH – sudden-onset severe headache, neck stiffness, nausea and some loss of balance. I can’t say that the headache was the worst that I have experienced, but it was severe and I would describe it as a burning sensation extending from both eyes over my head and into my neck.
Although aspirin is my usual analgesic of choice I took two Mybulen-type (Ibuprofen/Codeine/Paracetamol cocktail) capsules. I think this choice was fortunate as the anti-clotting properties of aspirin may well have aggravated the situation. I lay down for a while and although the headache diminished somewhat I must have been worried enough to go to casualty at my local small hospital later that afternoon where I was given a neck brace on the assumption that this was some sort of neck injury.
The next day, the headache had diminished, but not the neck stiffness or nausea. I went to see my GP, who wasn’t at that stage too concerned and suggested I see a physiotherapist, and come back the next day if I wasn’t feeling better. I couldn’t get an appointment to see a physio and the next day was feeling no better. At that stage my GP started to worry about meningitis and wanted to admit me to hospital (in all fairness to him and the doctor I had seen at casualty the previous day, I’ve read that statistically the average GP is only likely to come across 1 case of SAH every 8 years, and for that reason there is often an initial misdiagnosis).
On Thursday the tests for meningitis came back negative and my GP called in a Neurologist. She did a spinal tap on Thursday night, which revealed the presence of blood in my CSF. On Friday I had two lots of scans which revealed an aneurysm in my anterior communicating artery but no certain evidence of an SAH (there was some cortical flair intensity in the occipital and parietal lobes which the radiologist speculated ‘could represent a subarachnoid bleed’.
At that point I was transferred to a larger hospital and the care of a neurosurgeon. On the following Monday I was transferred to a specialist hospital about 85 km away from where I live and on Tuesday I underwent a six-hour procedure (apparently this normally takes about two hours, but my arteries are very ‘crooked’) to occlude the aneurysm through the coiling procedure. The procedure was carried out by an endovascular radiologist, assisted by a neurosurgeon. I woke up with the worst headache I have ever experienced. The 48 hour follow up scan revealed no complications. I remained in IC until the following Sunday when I was transferred to a surgical ward, and discharged on the Wednesday. I seem to recall sleeping through most of the days immediately after the procedure. At no stage that I can remember, was there any attempt to assess my cognitive abilities post procedure.
Looking back, it’s obvious that the bleed was a small one – what seems to be described as a sentinel bleed. Post-procedural symptoms included compromised balance for a few weeks, some visual disturbances (flashes of light and a bizarre slow-motion view of the world when moving my eyes rapidly at night just after turning on a light) as well as an onset of an episode of cluster headache. These all resolved within a month or two, although near-complete recovery took at least 6 months. The ophthalmologist I consulted regarding the visual disturbance said that he thought that they were caused by irritation of the optic nerves during the occlusion process?
What may be of more interest was a feeling of mild intoxication (and despite everything) a good mood from immediately after the bleed, lasting for a few months. Apparently this does occur in a very small percentage of SAH cases – but the opposite (mood deterioration and short-temperedness is far more common). I still have unpredictable memory lapses (names of plants in particular for some strange reason) and some prosopagnosia of a sort which makes me believe that I know people whom I have never met. I also had two experiences recently of suddenly not knowing where I was (or going) when driving, but these resolved after about 5 seconds or so. A follow up scan a few weeks ago has not shown anything remarkable and the aneurysm has been completely occluded. A battery of psychometric tests has also not shown anything remarkable.
I did feel as if I had become a different person for several months after the event, but seem now to have reintegrated ‘life before’ with ‘life after’. “
The textbook version of subarachnoid hemorrhage
Despite having taught intracranial bleeds to medical students for years, I was moved by Paul’s story to double check myself on two points that I and others invariably use to describe SAH:
- SAH is a medical emergency.
- SAH causes the worst headache of a lifetime.
Indeed, I was not mistaken. Of the four possible locations of bleeds (epidural, subdural, subarachnoid, and parenchymal), the two that are described as medical emergencies are epidural (what Natasha Richardson died from) and subarachnoid. Epidural and subarachnoid hemorrhages are emergencies because a large proportion of sufferers die as a consequence of these bleeds. Smaller proportions of people with subdural and parenchymal hemorrhages die. Yet, 10 days passes from Paul’s initial headache to his surgery. That is not exactly a medical emergency time frame. Heck, a tooth ache is likely to receive faster treatment.
Regarding the headache, Paul describes it as “severe… a burning sensation extending from both eyes over my head and into my neck.” On the other hand, Paul describes the headache after surgery as “the worst headache I have ever experienced.”
Both of the points on which Paul’s experience deviates from the standard SAH description are likely related to the fact that he had a sentinel (aka small) bleed (or two) rather than a full blown burst aneurysm. The headache was not the worst possible because the bleed was small, small enough to not be even close to lethal and small enough to not cause a horrible headache.
It is ironic that the really bad headache resulted from the coiling of the aneurysm rather than from the sentinel bleed. I don’t know that neurosurgeons warn patients about that. I also am unclear why a terrible headache would result from coiling. [The coil is threaded in through a blood vessel that is outside the cranium (e.g. femoral artery). I would not expect this to result in bleeding outside the vessel. What else could be responsible? Well, the blood vessels of the cranium are innervated by nociceptors, sensory neurons whose activation can lead to a perception of pain. Activation of these nociceptors does lead to headache and an excess of nociceptor irritation from the prolonged surgery may be the reason for Paul’s horrible pain.]
Does average even exist?
Now let’s talk about the concept of average, standard, normative. For this, I thank my train buddy, Lorenzo, who came up with this gem the other day. Imagine that every person can be described by some number of normally distributed features or traits. Normal simply means that the largest number of individuals are smack in the middle and everyone else is evenly distributed on either side of that middle. For example, if the trait is the width of the right thumbnail, then maybe 20% or so of all individuals have the average width, x. Then the same lesser proportion of people has wider thumbnails, x+a, as has narrower thumbnails, x-a (see yellow dots in Figure 1 below). Now consider that you have ten traits and that for each one you take the middle 90% as “Jane-Doe-Joe-Blow-average.” That only leaves out 10% of the population for any given feature. In our example, the middle 90% would include everyone except those with the narrowest 5% and widest 5% thumbnails.
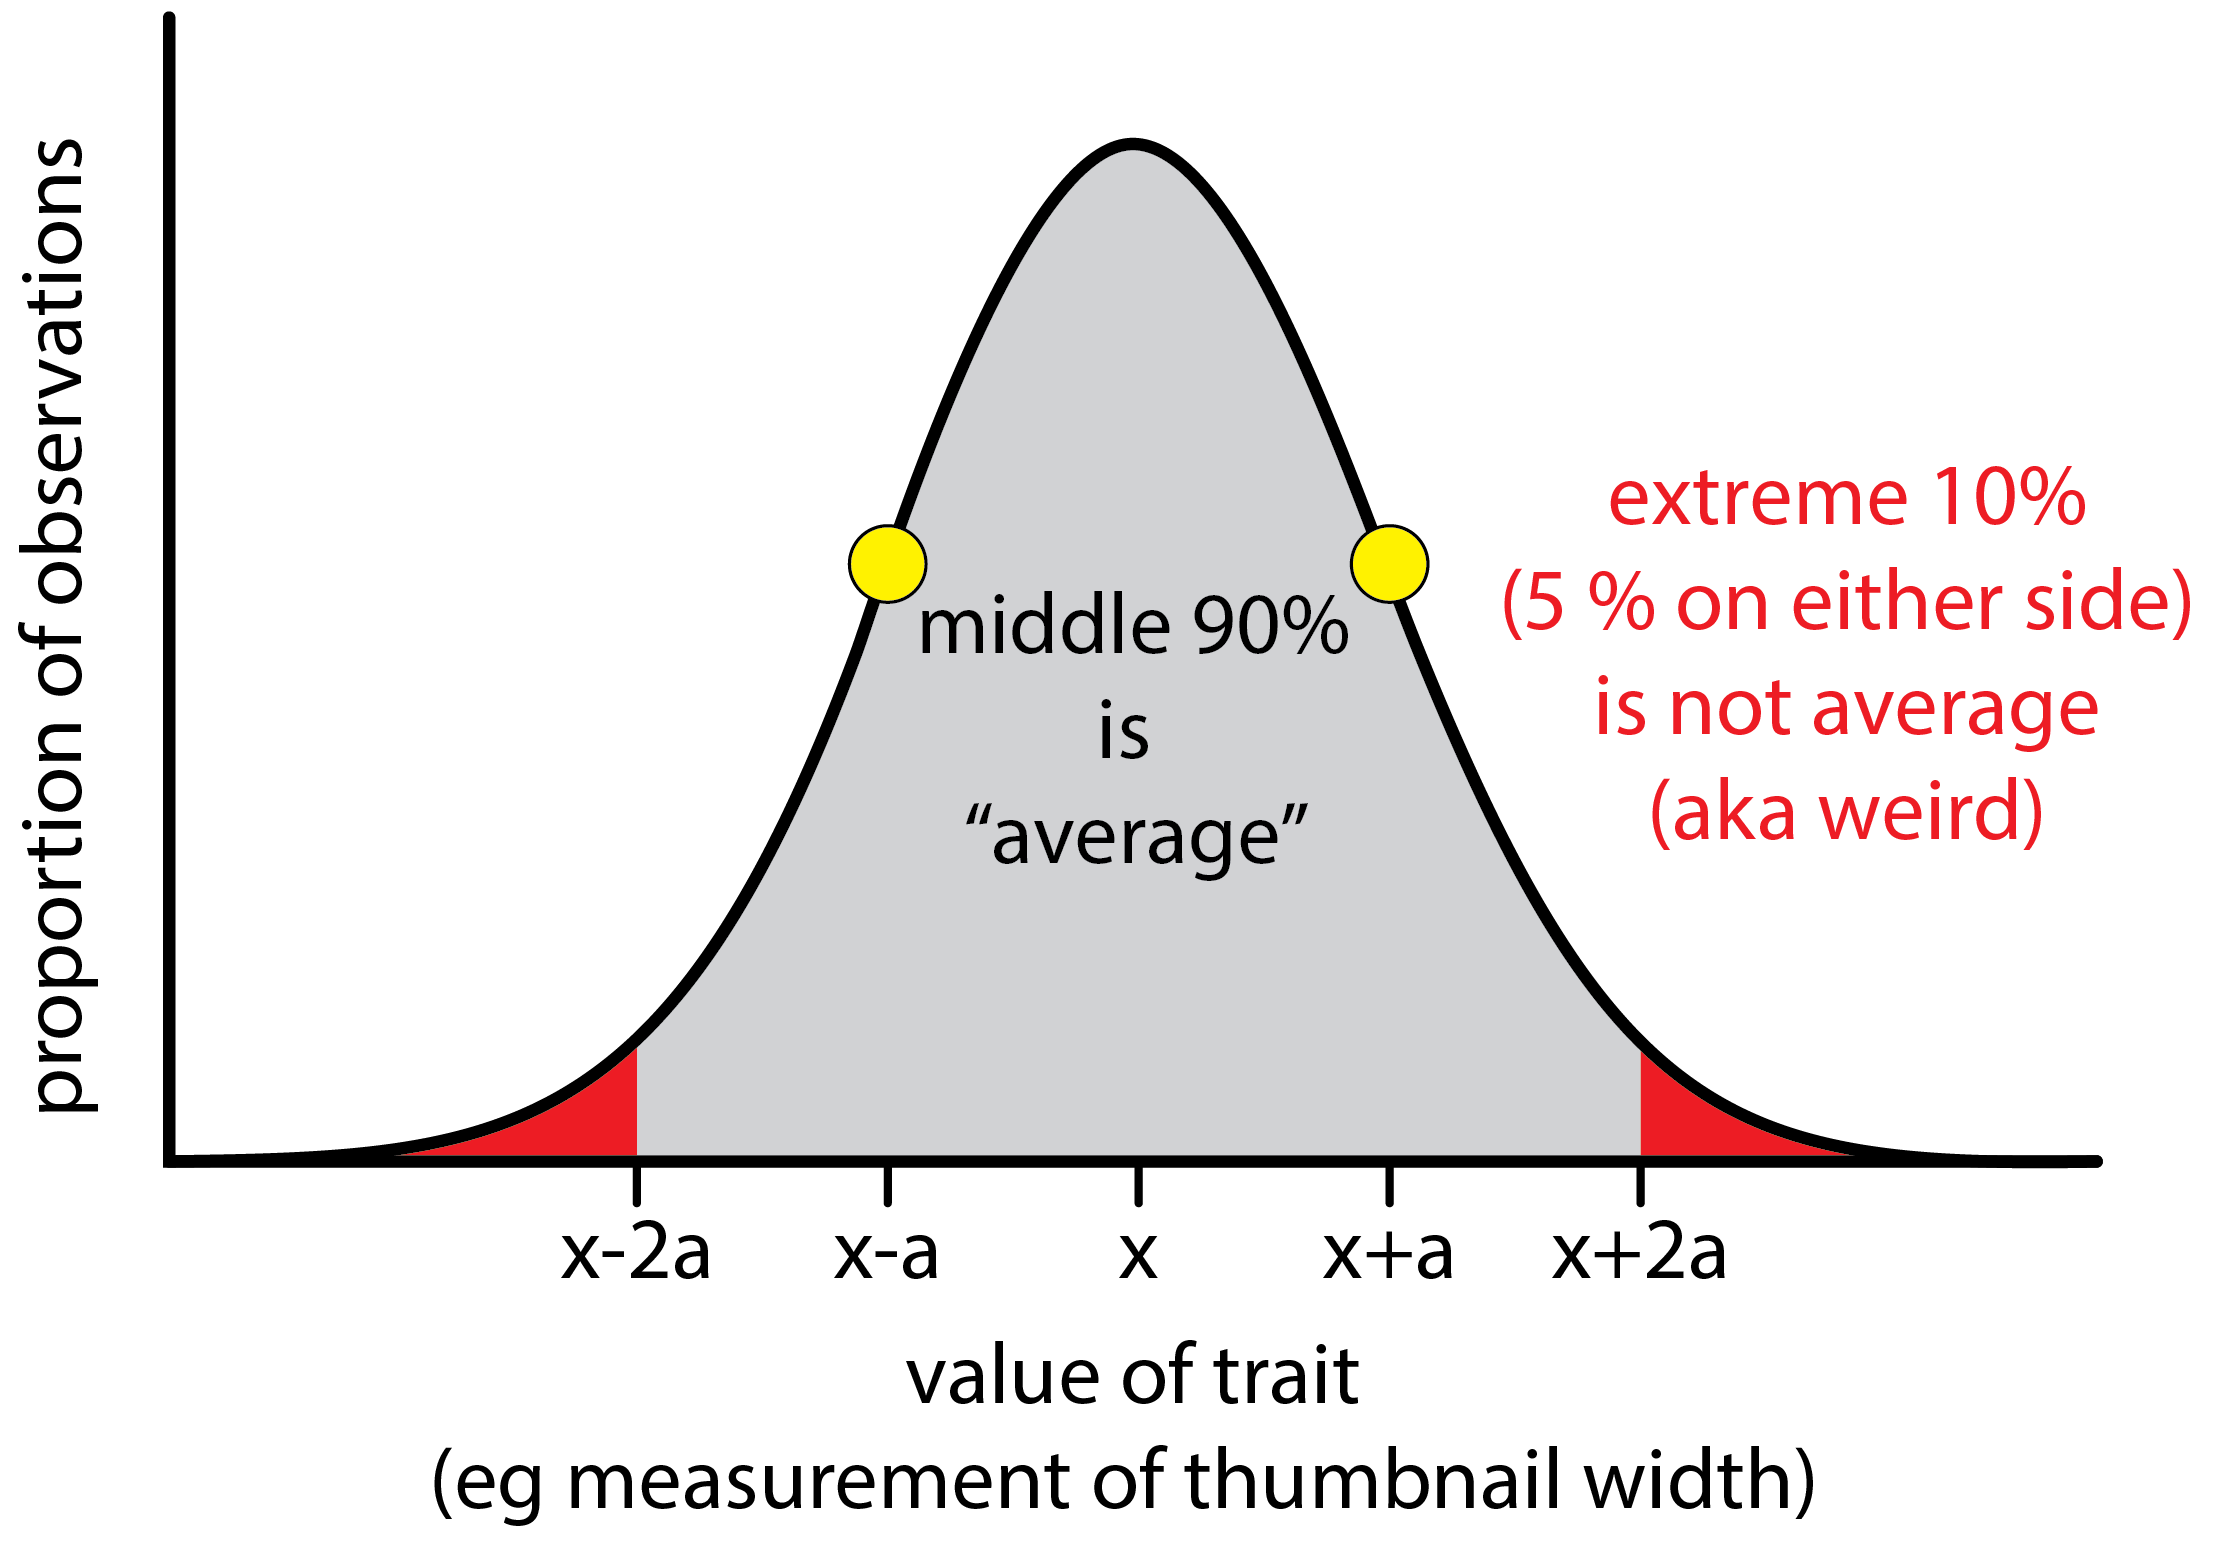
Figure 1, This depicts a normal distribution. Note that normal distributions peak well below 100%. In other words the greatest proportion of observations will have the mean value of x but that proportion will be in the range of 15-35%. Here we have given a generous definition to average as the middle 90% of the distribution (gray region). Only the extreme 5% on the low and high sides (red areas) are not average by this definition.
What is the chance that any one person will be average in thumbnail width? The answer is 90% or 9 out of 10 people will. So far, so good. Now let’s consider that we consider additional traits, all similarly normally distributed, and all independent.
The traits need to be independent as otherwise we would be stacking the cards, so to speak. Let’s say that one trait is the right thumbnail’s width and another is the left thumbnail’s width. In such a case, we are not adding much that we didn’t already know by adding the second trait. We can predict the left thumbnail’s width fairly well if we know the right thumbnail’s width. The second trait is uninformative and the two traits are not independent.
We continue to define average in the same way; that is as the central 90%.
All this build up is to ask, what proportion of people will be average in multiple traits? Well, if 90 out of 100 are average in trait 1, and 90% of the 90 are also average in trait 2, then we are at 81 of 100 expected to be average in traits 1 and 2. We can continue this for multiple traits as shown in the graph below:
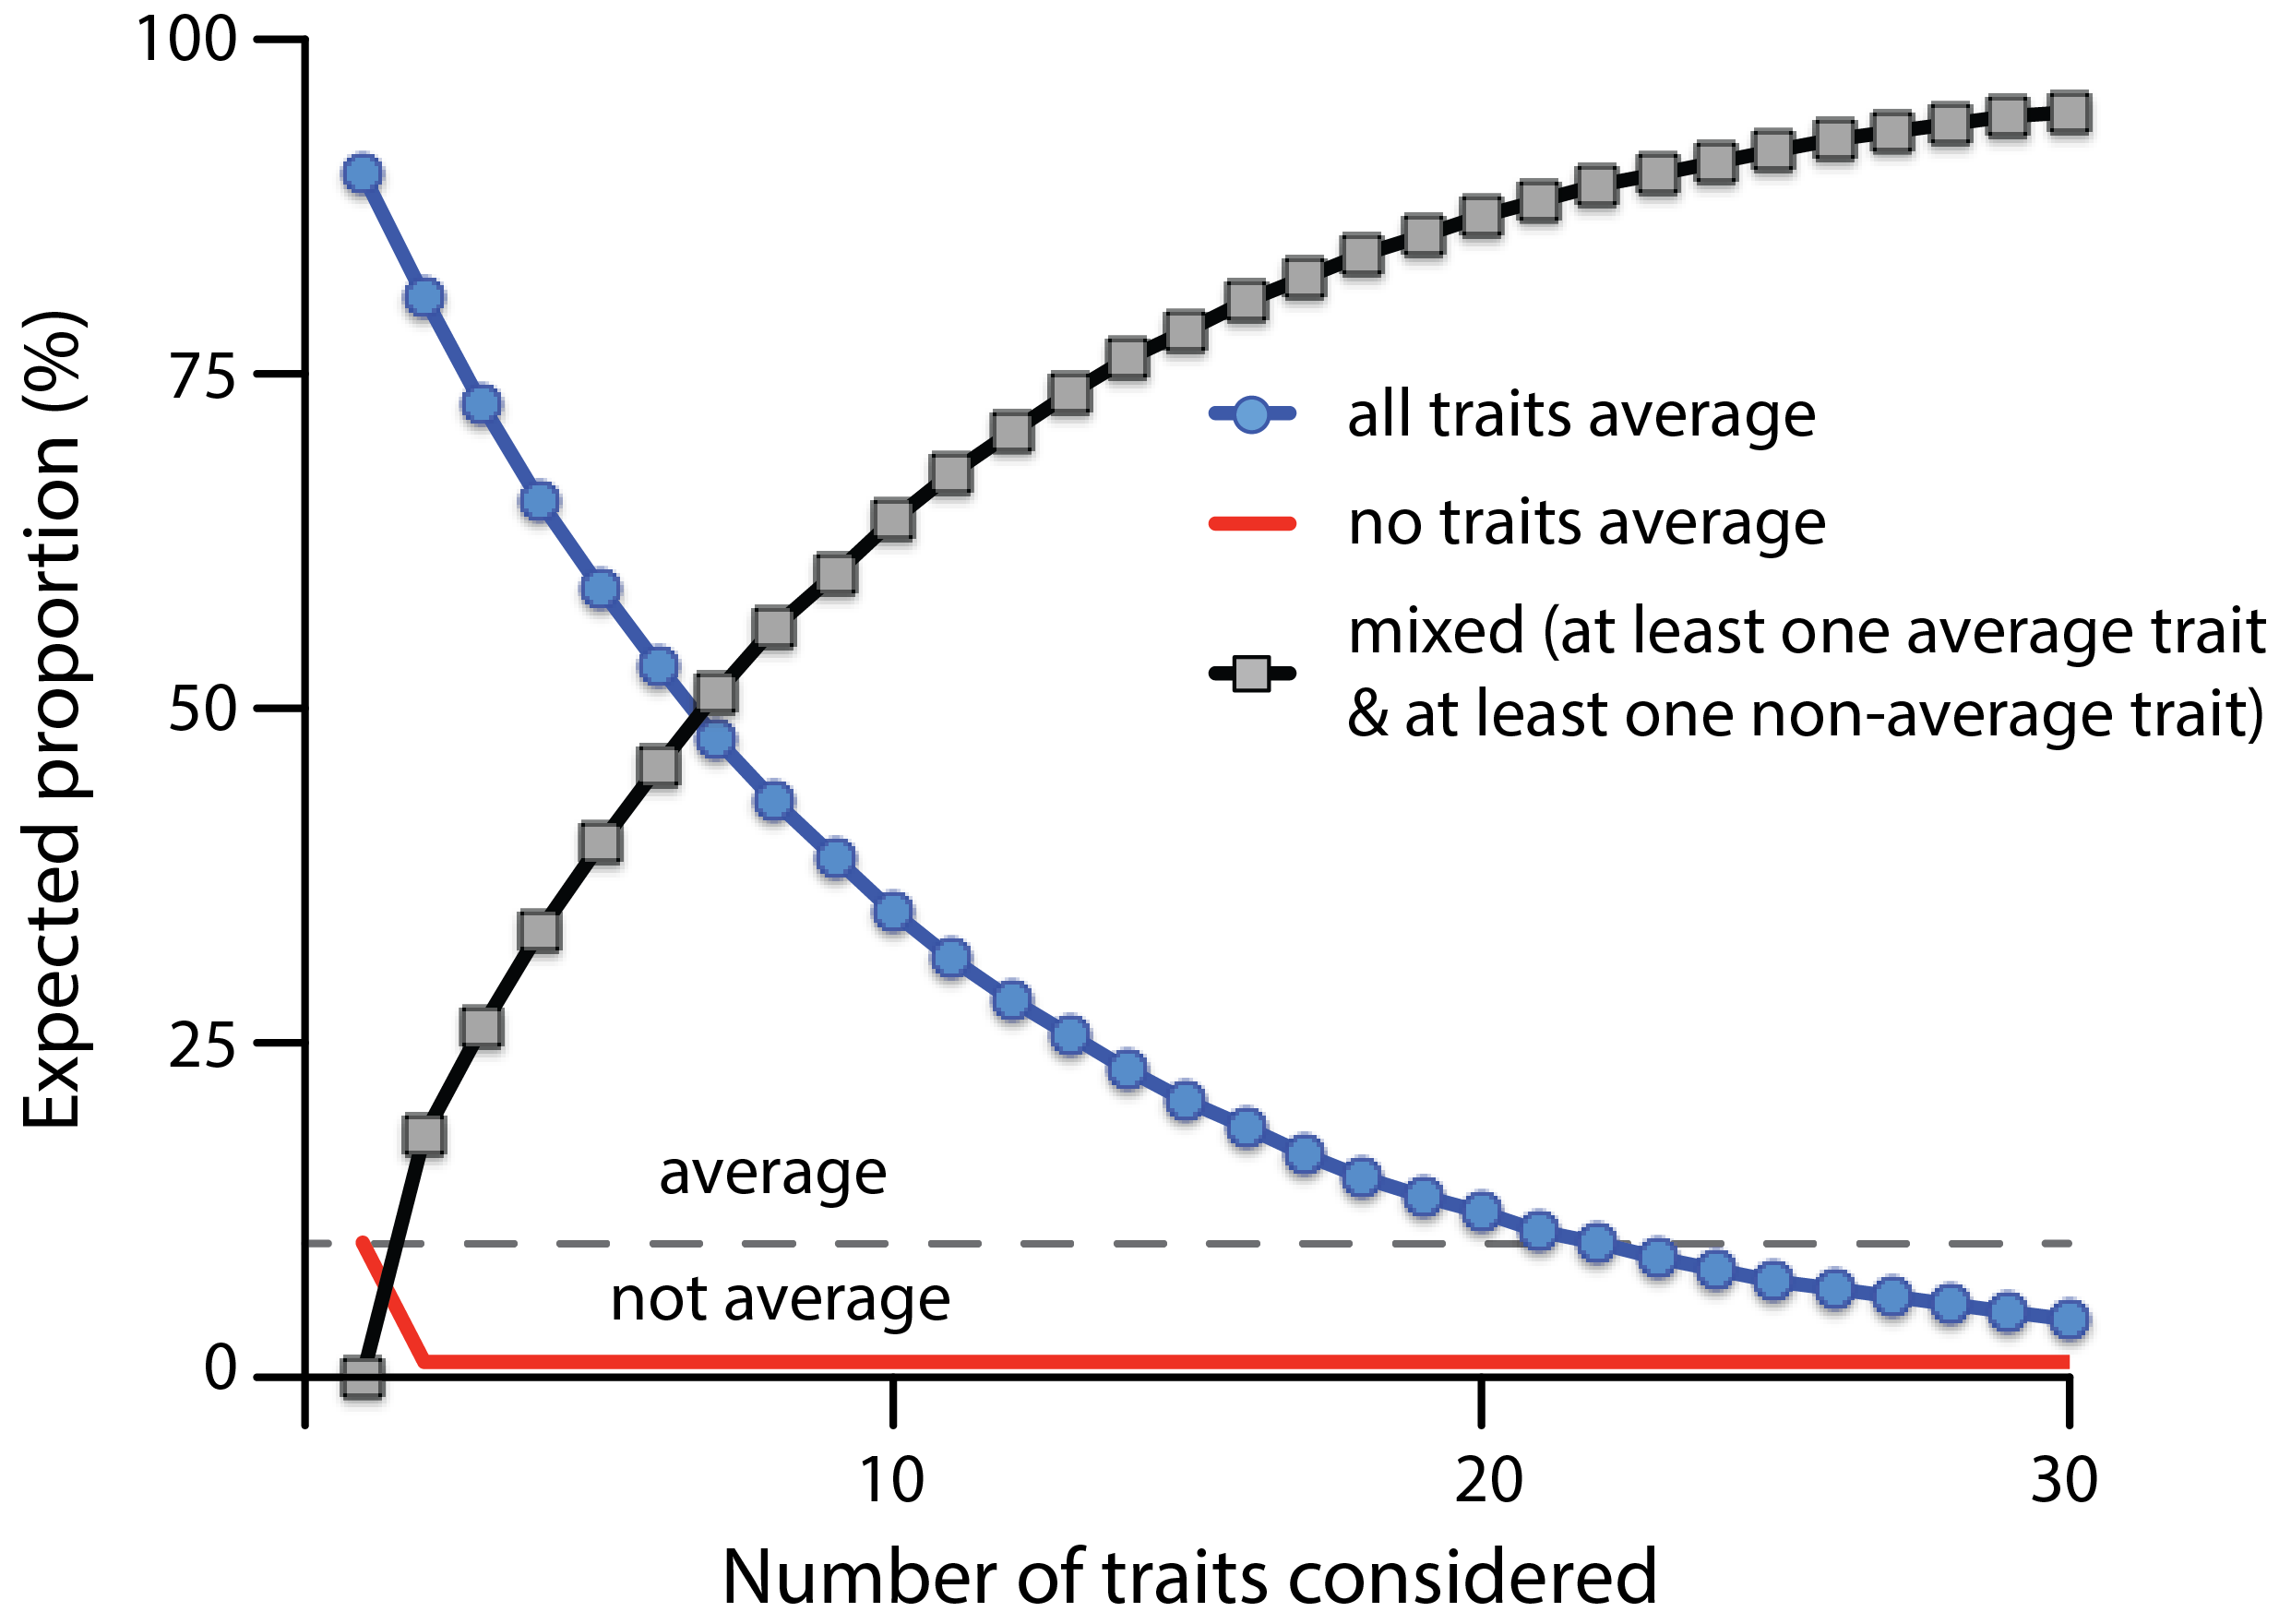
This shows the expected proportion (y-axis) that are average on all traits (blue line with circles) or on no traits (red line) as a function of the number of traits considered (x-axis). As the number of traits considered increases, the proportion of those with a mix of average and non-average traits grows so that it is greater than the all average group by 7 traits (the point where the black and blue lines cross).
What this graph tells us is that the chances of an individual being average on multiple independent traits declines exponentially with the number of traits involved. If we consider 10 traits, only 35% would be expected to be entirely average across the board. If we consider 20 traits, that proportion is down to 12%. Once we hit 22 traits, we’ve fallen under our definitional line for average (10%).
Of course this analysis depends on our definition of average. How much difference does this make. Well, let’s go all democratic here and consider the central 51% as average. Then the number that will be average on 2 traits would be 26%; on 3 traits, 13% and on 4 traits, 7%. Now let’s go in the other direction and be really stringent about what we consider weird. Let’s say that the central 95% is average and only the 2.5% fringes on either side are not average. In this case, it takes 50 traits before the expected proportion for all-average falls below 10%. Given that we have thousands of independent genetic loci (and many non-independent, linked loci as well) along with a number of physical (height, eye color) and demographic (sex, age, country, smoking history, meat consumption, lead exposure, and so on) traits, getting to 50 is easy.
Conclusions
What are the take home messages here? Most of us are middling in some respects and not in others. When we have a disease, we are almost guaranteed to have some symptoms (or lack thereof) that differ from the classic (normative) presentation. The average is theoretical, only really existing with a narrow focus on just a handful of traits. In other words, we are all quirky in one way or another. Quirky is the norm. I think that is for the best.
Categories: Neurological disease or impairment, Psychology


I’m one of those Behaviorist’s from the 1960’s who think in terms of “individual differences”. So, I am not surprised, we just do the best we can with the clues we have.
LikeLike
So interesting – especially the feeling of intoxication for a couple of months and the fact that the opposite mood usually occurs. Why any mood change? And why would there be lingering symptoms (I would think suddenly not knowing where you are would be quite disconcerting) so many months post surgery?
An aneurysm was found in my mom (a year after my dad died she asked me where he was) at the basilar tip of her brain and at 71 she decided to take her chances. Was instructed to get a yearly scan but didn’t want to spend the government’s money for such an unnecessary thing. 🙂 For an unrelated reason she had a scan at 91 and was told the aneurysm had calcified.
LikeLike
Paul’s doc’s initial reaction reminds me of why @kj_hammond recommends AI diagnoses. The fact that a computer rarely sees a given set of symptoms would not diminish its ability to recognize them.
LikeLike
Reblogged this on Neuroscience Is The New Black and commented:
S. S. Post writes about “The Death of Normalcy.” here, Prof. Peggy Mason @neuromooc slaps around the idea of “average”.
LikeLike
Hi great readingg your blog
LikeLike